前回はjsonで電力測定値をクライアントに送れるようになった。
e-tipsmemo.hatenablog.com
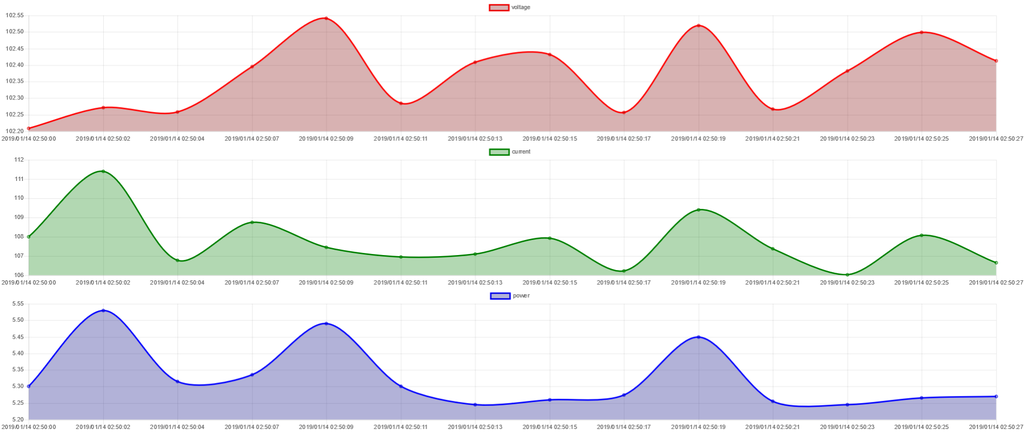
これをきれいにグラフ化したい。
そこでChart.jsを使う。
Chart.jsによる折線グラフ作成<Chart.js<Javascript<木暮仁
とりあえず必要
<script src="https://cdnjs.cloudflare.com/ajax/libs/Chart.js/2.7.1/Chart.min.js"></script>
表示部分は
  <body>
    <input type="text" name="message" value="">
    <input type="button" name="buttonMsg" value="send message">
    <input type="button" name="buttonDiscon" value="disconnect">
	<div class="contents">
    <canvas id="voltageChart"></canvas>
	</div>
	<div class="contents">
    <canvas id="currentChart"></canvas>
	</div>
	<div class="contents">
    <canvas id="powerChart"></canvas>
	</div>
  </body>
divで囲んでおかないとサイズをいい感じに変更できない。
とりあえずテストデータとして、
var testdata = ["{\"time\":\"2019/01/14 02:50:00\",\"voltage\":102.209,\"current\":108.00781,\"wattage\":5.3}",
		"{\"time\":\"2019/01/14 02:50:02\",\"voltage\":102.271,\"current\":111.39844,\"wattage\":5.53}",
		"{\"time\":\"2019/01/14 02:50:04\",\"voltage\":102.258,\"current\":106.765625,\"wattage\":5.315}",
		"{\"time\":\"2019/01/14 02:50:07\",\"voltage\":102.396,\"current\":108.74219,\"wattage\":5.335}",
		"{\"time\":\"2019/01/14 02:50:09\",\"voltage\":102.541,\"current\":107.453125,\"wattage\":5.49}",
		"{\"time\":\"2019/01/14 02:50:11\",\"voltage\":102.285,\"current\":106.94531,\"wattage\":5.3}",
		"{\"time\":\"2019/01/14 02:50:13\",\"voltage\":102.409,\"current\":107.10156,\"wattage\":5.245}",
		"{\"time\":\"2019/01/14 02:50:15\",\"voltage\":102.432,\"current\":107.921875,\"wattage\":5.26}",
		"{\"time\":\"2019/01/14 02:50:17\",\"voltage\":102.257,\"current\":106.21875,\"wattage\":5.275}",
		"{\"time\":\"2019/01/14 02:50:19\",\"voltage\":102.519,\"current\":109.40625,\"wattage\":5.45}",
		"{\"time\":\"2019/01/14 02:50:21\",\"voltage\":102.267,\"current\":107.38281,\"wattage\":5.255}",
		"{\"time\":\"2019/01/14 02:50:23\",\"voltage\":102.383,\"current\":106.03125,\"wattage\":5.245}",
		"{\"time\":\"2019/01/14 02:50:25\",\"voltage\":102.499,\"current\":108.07031,\"wattage\":5.265}",
		"{\"time\":\"2019/01/14 02:50:27\",\"voltage\":102.413,\"current\":106.65625,\"wattage\":5.27}"];

var hoge = [];
var v = [];
var c = [];
var p = [];
for(var i=0;i<testdata.length;i++)
{
	var t = JSON.parse(testdata[i]);
	hoge.push(t['time']);
	v.push(t['voltage']);
	c.push(t['current']);
	p.push(t['wattage']);
}
その後、chartを作成する。
電圧、電流、電力のグラフを作ったがとりあえず一つだけ。
var vctx;

vctx = $('#voltageChart').get(0).getContext('2d');

const vchartDataSet = {
type: 'line',
data: {
  labels: hoge,
  datasets: [{
	label: 'voltage',
	data: v,
	tension: 0.3,
	backgroundColor: 'rgba(125, 0, 0, 0.3)',
	borderColor: 'red'
  }]
},
options: {
  responsive: true,
  maintainAspectRatio: false
}
};

new Chart(vctx, vchartDataSet);

次はこれをwebsocketのon_messageで更新するようにする。

ラトックシステム Bluetoothワットチェッカー REX-BTWATTCH1
- 出版社/メーカー: ラトックシステム
- 発売日: 2014/07/17
- メディア: Personal Computers
- この商品を含むブログを見る